This work was jointly done with Wei Hong†, David Gay†, Phil Buonadonna†, Tom Doeppner*, Alan Mainwaring†
*Department of Computer
Science, Brown University, Providence, RI 02912.
†Intel Research Berkeley, 2150 Shattuck Avenue, Berkeley,
California 94704.
 |
| My Cube at Intel Research Berkeley + German Lic Plate |
Modular architecture of TinyOS, an operating system for sensor
nodes, presents a set of components that can be combined in multitude of ways
to get a desired level of functionality. The current implementation included in
TinyOS 1.1. provides configurable
network, link and radio layers, which can be combined to form an
integrated routing layer with specific properties. e. g. for a network system
requiring data reliability with stringent power needs and reasonable system
interactivity, link layer acknowledgements can be combined with the Low Power Listening radio stack to get
the desired functionality. We wanted to see which combination of network, link
and radio layer performs the best based on two main performance metrics - power
usage on each sensor node and the data success rate (fraction of requested data
received). Network scalability was another issue we wanted to look at. Can a
large Sensornet scale with number of nodes while still retaining a high
successrate across all the nodes? If the answer is yes, then how well it can
perform and; if no, then we want to find the reasons for the bad
performance.
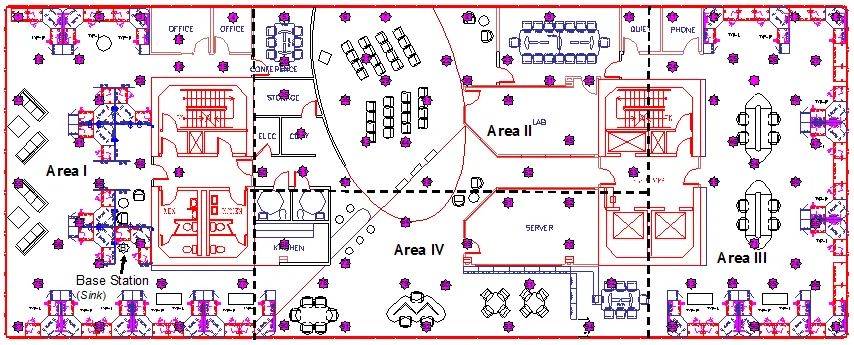 |
The 100 node test bed: A typical inverted
tree used for routing data to the base station (sink)
|
A Sensornet deployment can be characterized by a set of
parameters namely sample interval of the sensor readings, scale, sensor node
distribution, and radio characteristics of the deployment area. Consider the
recent sensor deployments, namely BP ship, Intel Fabapp, Great Duck Island, Golden Gate Bridge,
and Redwood deployment. All these deployment were long term spanning several
days/months. But they varied in the sampling period of sensor readings, data
transfer (bulk vs. small sensor readings), scale (the number of nodes in the
system), and environmental conditions. Redwood Deployment required a sampling
period of 5 minutes as oppose to the BP deployment where the sampling period
was 16 hours. Sensors in the BP ship deployment were placed in a harsh
environment inside a ship monitoring vibration readings in the motor room. The
RF characteristics varied across each deployment. Golden Gate
deployment tracks local stresses on the Golden Gate Bridge.
Since the sensors are placed in the vicinity of the vast metal structure (the
bridge itself), the radio waves are attenuated. The Redwood tree deployment was
in the outdoor space. BP ship deployment was inside the ship around heavy
machinery. We wanted to characterize the
effect of these deployment dependent parameters on the different routing
combinations. A performance characterization of these parameters is expected to
give some insight on which routing layer combination to use for a specific
deployment.
We present the results obtained from the evaluation of different
combinations of radio, link and network layers available (Standard, Mint,
Reliable, Reliable Low Power, Reliable Time Sync, and HSN
DSDV) on a testbed of 100 mica2 motes
at Intel Berkeley Research Lab.
 XMOHAN